
Most public-health datasets are collected for a single purpose: a survey round, a programme report, a funder’s indicator. The analysis gets done, the report goes out, and the data quietly becomes hard to use again. A year later, a new team asks a related question and finds itself rebuilding what already existed, often without knowing exactly how the original numbers were produced.
Reusability is rarely lost at the analysis stage. It is lost earlier, in decisions about how data is defined, cleaned, and stored. The good news is that the habits that make data reusable are practical, inexpensive, and teachable.
Start with definitions people can find
A variable name is not a definition. “Vaccinated”, “case”, or “facility visit” can each mean several things depending on the time window, the source, and the rules applied. When those rules live only in an analyst’s head or in an email thread, every future user has to guess.
A short, maintained data dictionary changes this. For each variable it should record:
- what the variable means in plain language;
- the source it comes from and the time period it covers;
- allowed values, units, and how missing values are coded;
- any rule used to derive it from other fields.
This is not bureaucracy. It is the single most useful document a future analyst, auditor, or partner institution will ask for.
Document every transformation
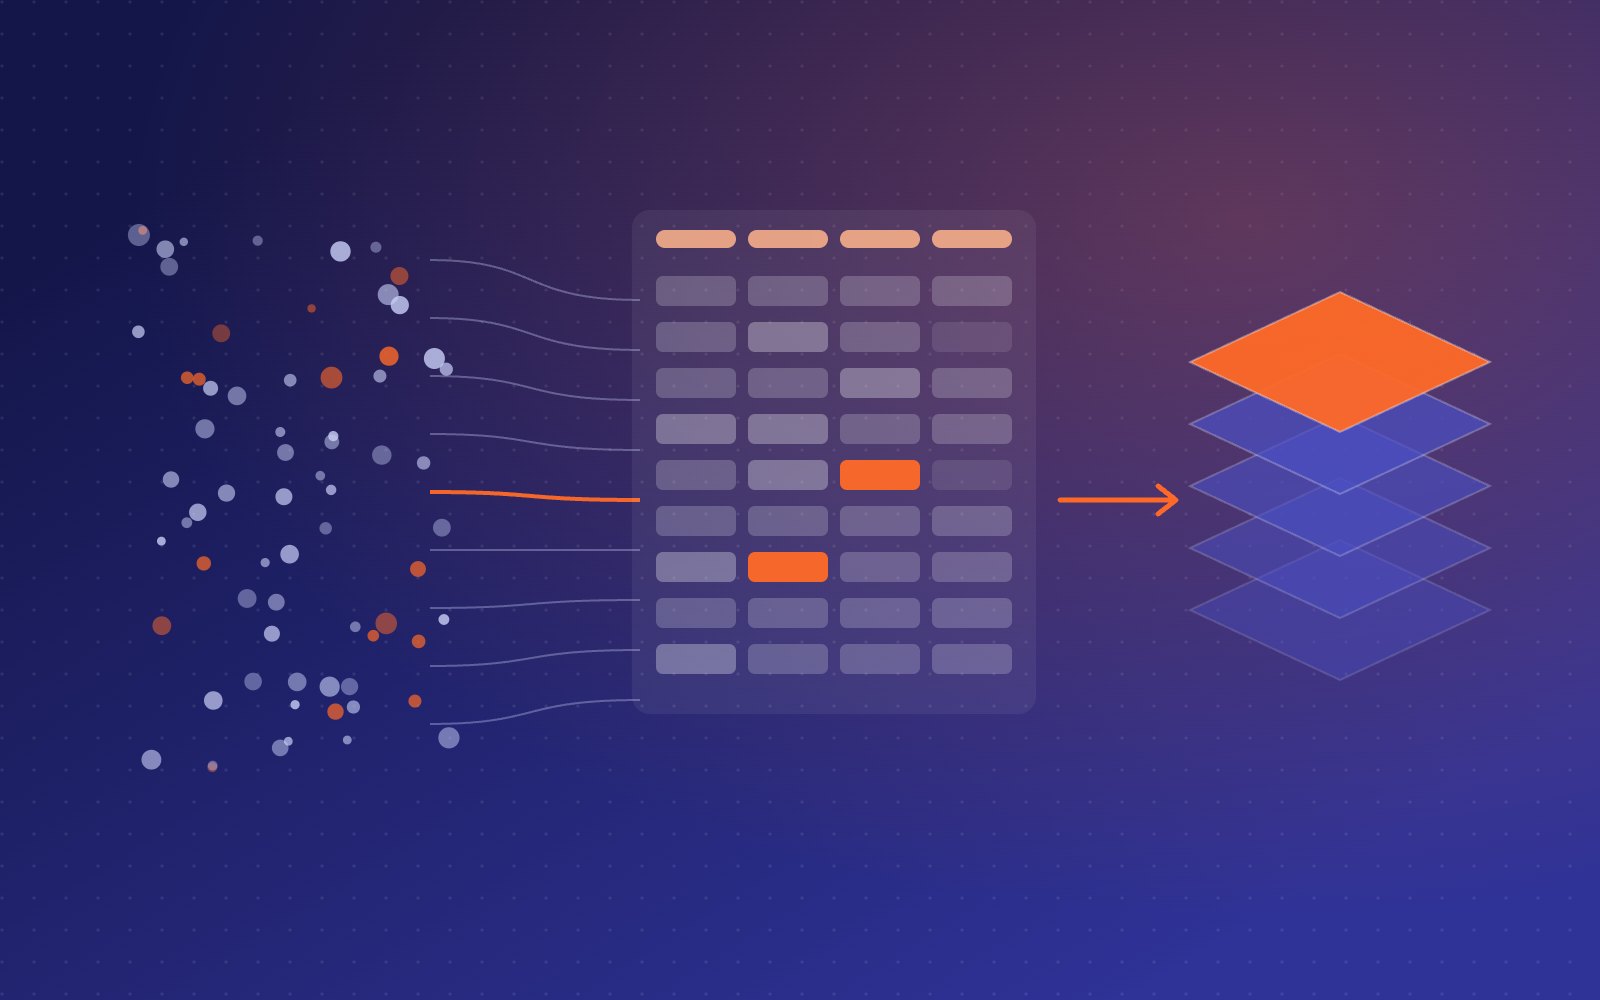
Raw data almost never goes straight into an analysis. Records are deduplicated, dates are standardised, categories are merged, and outliers are reviewed. Each of these steps is a decision, and each decision changes the result.
When transformations are done by hand in a spreadsheet, they are difficult to see and impossible to repeat exactly. When they are written as scripts, in R, Python, or SQL, with comments explaining why a step exists, the whole path from source to result becomes visible. Anyone can rerun it, check it, or adapt it.
A useful test: could a colleague who was not involved reproduce your final table from the raw files, using only what is written down? If not, the knowledge needed to reuse the data is still trapped with the people who made it.
Make workflows reproducible by default
Reproducibility is often treated as an academic standard. In practice, it is an operational one. Programmes need to produce the same indicator every quarter. Ministries need to compare this year with last year. Partners need to trust that a number means the same thing across sites.
A few habits make this routine:
- Keep raw data read-only. Work from copies, and never overwrite the original source.
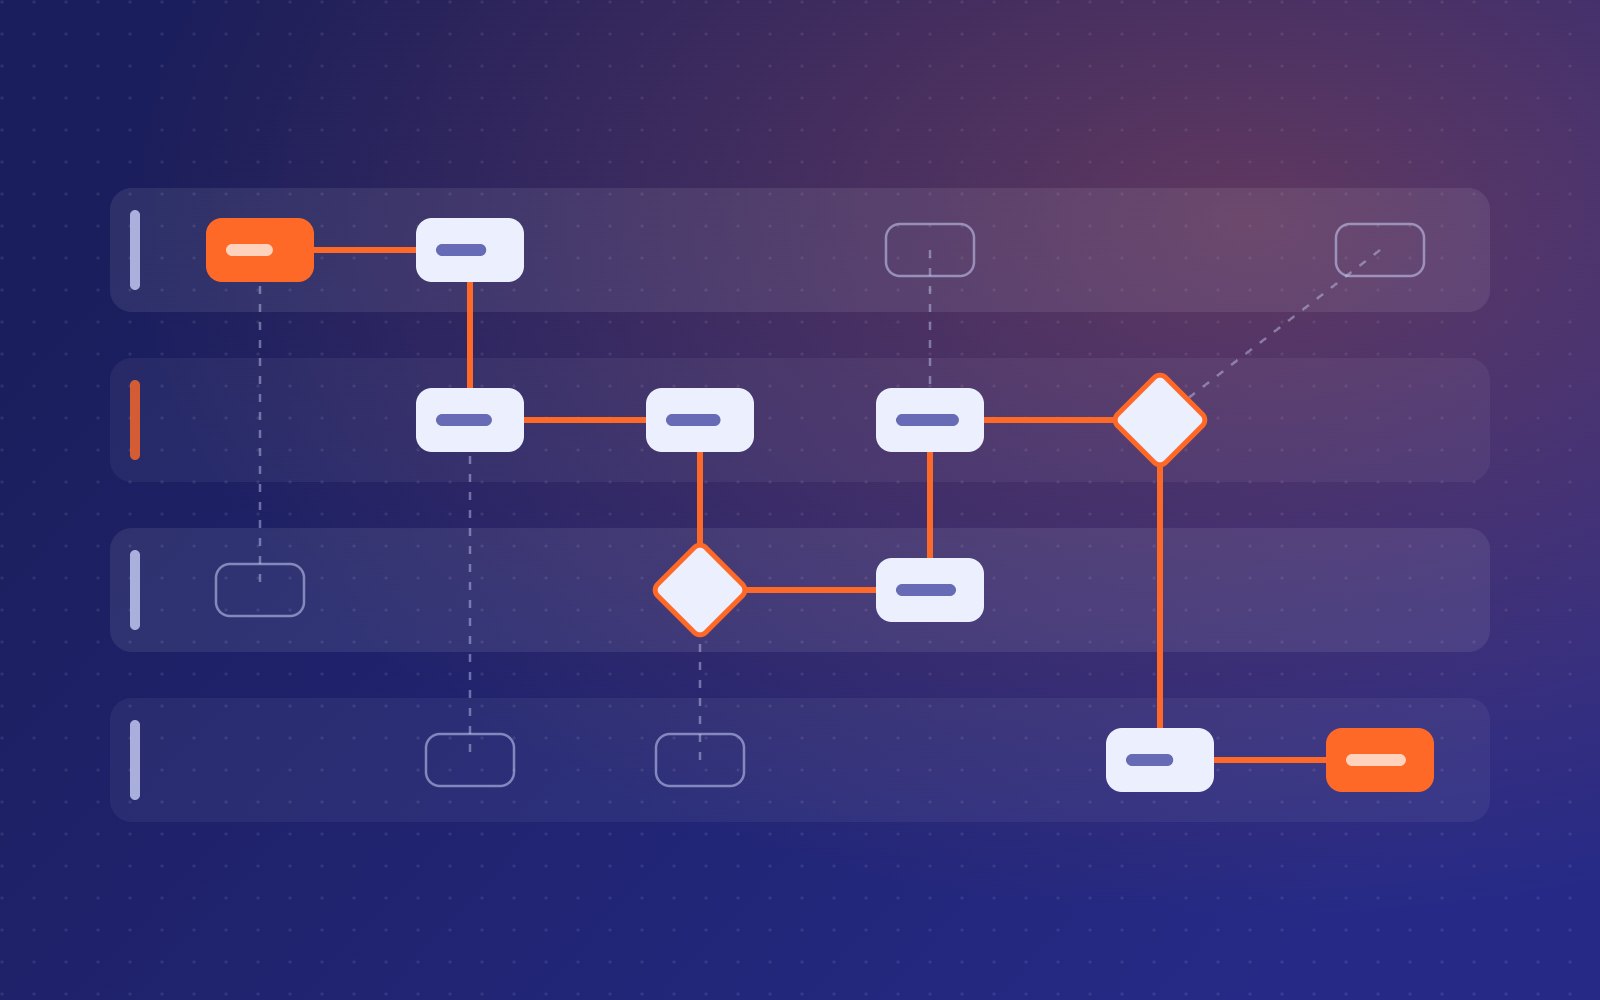
- Separate steps. Keep import, cleaning, analysis, and reporting as distinct stages with clear inputs and outputs.
- Use version control. Track changes to scripts and the data dictionary, so it is clear what changed and when.
- Record the environment. Note software versions and packages, so results can be regenerated later.
None of these require large budgets or specialist infrastructure. They require agreement that the way work is done matters as much as the result.
Plan for the next user
Every dataset has a next user, even if no one knows who it will be. It might be a new analyst on the same team, a researcher answering a policy question, or a partner combining sources across countries. Designing for that person means asking a few questions early:
- Will someone outside this project understand what each field means?
- Is it clear what can and cannot be shared, and under what conditions?
- Are identifiers handled so that linking is possible where appropriate, and privacy is protected where it matters?
Thinking about reuse at the start costs little. Retrofitting it later is slow, expensive, and sometimes impossible.
What this means for institutions
Reusable data is not only a technical achievement. It reflects how an institution values its own evidence. Teams that document definitions, script their transformations, and plan for the next user build a body of knowledge that grows over time, rather than starting from zero with every new question.
At Praxis Global Institute, this is how we approach research and data work: connecting source data, clear methods, and reproducible workflows so that evidence can be used, checked, and built on. If your institution is working to make its data more useful beyond a single report, we would be glad to start a conversation.
Simon Aseno
Simon Aseno is President and CEO of Praxis Global Institute, where he leads work connecting research, technology, education and advisory to strengthen people, systems and institutions.
Facing a similar challenge in your institution?
We work with teams on research, data, digital systems, and learning that hold up in practice.